How to Measure Concentration in Your Investment Portfolio
Divide each holding’s current value by the portfolio total, then add the largest weights. This shows where a few investments dominate your money.
Jenius Tech SRL
Measure portfolio concentration by dividing each position’s current market value by the portfolio total, then adding the weights of the largest positions. A €4,000 holding in a €10,000 portfolio weighs 40%. This measures size, not the probability of loss.
This educational example uses fictional holdings and is not personal investment advice. We make Open Fire; it can help you inspect holdings, not guarantee investment outcomes.
Calculate individual position weights
Use values from the same date, in one currency. Decide whether cash belongs in the total. Our fictional €10,000 portfolio includes cash:
Company A: €4,000 ÷ €10,000 × 100 = 40%.
Company B: €2,500 ÷ €10,000 × 100 = 25%.
Broad-market fund C: €2,000 ÷ €10,000 × 100 = 20%.
Bond fund D: €1,000 ÷ €10,000 × 100 = 10%.
Cash: €500 ÷ €10,000 × 100 = 5%.
The weights sum to 100%. Use current market values, not only original cost: performance changes concentration without a trade. Excluding cash gives a €9,500 denominator and Company A weighs about 42.1%. Those are different definitions, not conflicting calculations.
Add the largest holdings
Top-one concentration is 40%; top-two is 40% + 25% = 65%; top-three is 40% + 25% + 20% = 85%.
If Company A alone fell 30% while everything else stayed unchanged, the portfolio would lose €1,200, or 12% of its starting value. This is arithmetic under stated assumptions, not a forecast or worst case.
There is no universal safe top-three percentage. Time horizon, liquidity needs and underlying assets matter. FINRA’s concentration-risk guidance explains how overlapping funds and related holdings can hide shared exposure.
Review holdings in Open Fire
Inspect the demo’s example holdings, then apply the formula to your own values.
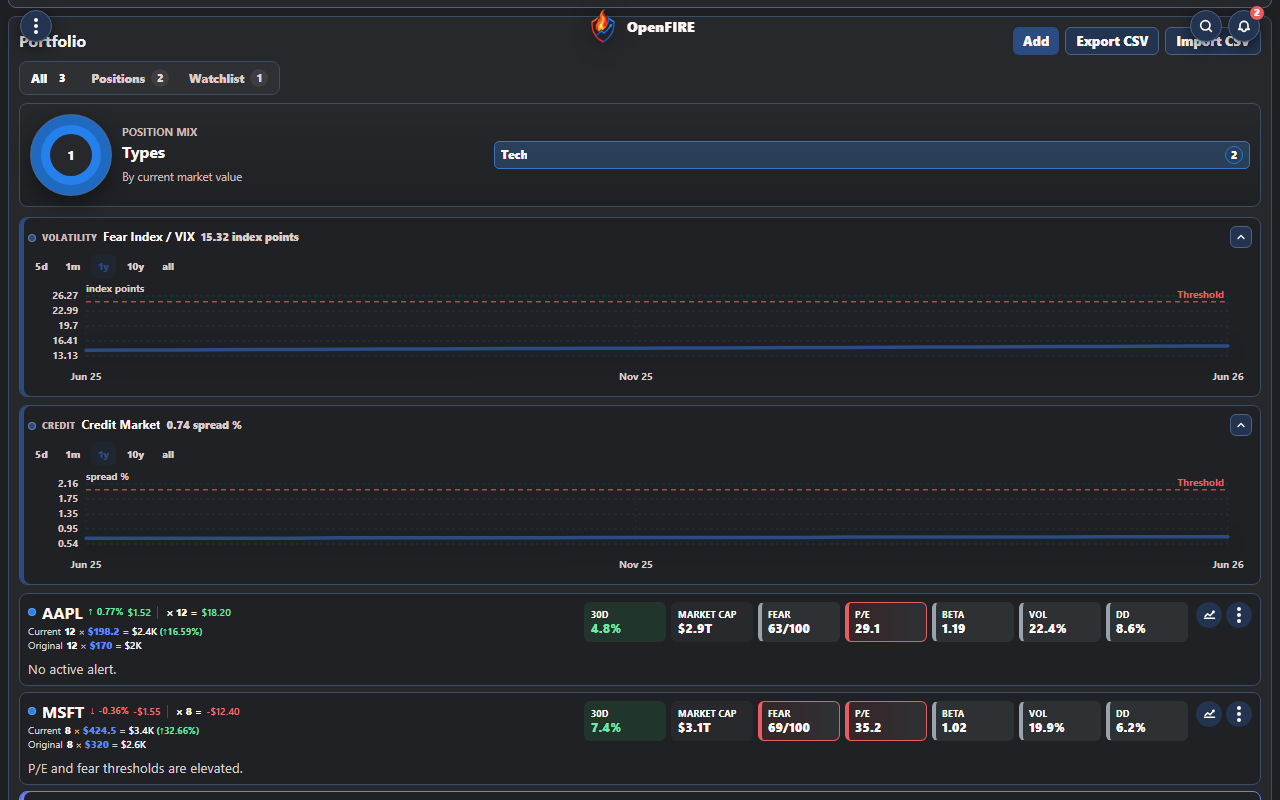
Open Fire’s portfolio view puts positions and values together. Inspect its example holdings in the embedded demo, then repeat the calculation for your own portfolio. The demo holdings differ from the fictional five-line example above.
Review quantities and current values.
Convert different currencies to one consistent snapshot.
Divide the largest value by the chosen total and add the next two weights.
Check sectors and fund holdings before concluding that different tickers mean diversification.
The real screenshot shows the portfolio interface. It does not imply that Open Fire automatically calculates this article’s custom top-three measure or looks through every fund. Use a calculator or spreadsheet for the worked formula.
What the calculation cannot tell you
Five tickers might all depend on one sector. Fund C might also own Company A, increasing economic exposure beyond the direct 40%. A bond fund is not risk-free cash.
Position weights do not measure volatility, correlation, leverage, liquidity, currency risk or other accounts. Investor.gov’s diversification guidance explains why spreading investments cannot prevent all market losses.
Review concentration when values or circumstances change. A large weight is a reason to investigate, not an automatic instruction to sell.